Dabbling with OpenStreetMap
As a person who enjoys travel, I’ve made use of the work of cartographers for many, many years. I appreciate data that helps me get from Point A to Point B with minimal awkwardness and fuss. Not having to ask for directions clearly falls within that category.
A recent assignment was centred around contributing to OpenStreetMap (and subsequently writing a blog post about it; suspicious coincidence that you’re reading this, no?). Many of the digital humanities projects discussed in class have to do with making data more accessible on the web, particularly in open source forms, in order to facilitate collaboration. If we all share, we all learn, yes? Yes.

However, much of the subject matter upon which classes focus is either historical in nature – digitising archived correspondence and genealogical information, for instance – standardising XML, or mapping. While these all have noble purposes, they are, for the most part, not at all relevant to the focus of my thesis. There is a chance that, in the distant future, location information may play a role in building accuracy into film production. Yet such a thing would be part of PhD research, and would not fit within the scale of my current studies.
That being said, acquiring new skills is good for the brain and the CV. So off we go!
Choices & Learning
To prepare, I took a look at the Beginner’s Guide on the OpenStreetMap Wiki. It’s a very short page which introduces some terminology and points the way to different software options for editing. Some of my classmates had expressed their frustration with JOSM (Java OpenStreetMap Editor), in that the tutorial information available was patchy. I duly downloaded and installed the application, including updating to a more recent version of Java on my laptop. I reviewed the Facebook discussions of those who had gone before, then headed to YouTube to look for instructions.
[youtube=https://youtu.be/Ir-3K0pjwOI]
My search revealed what I was looking for, along with several other related videos. I chose Learn How To Map in OpenStreetMap first. Turns out it was not about JOSM, rather about iD, another editor which is directly accessible from within a browser. It’s great for beginners, simple, does the basics. Not being terribly invested in the whole mapping shenanigans, this seemed a much better option than jumping through needless hoops.
The Locale
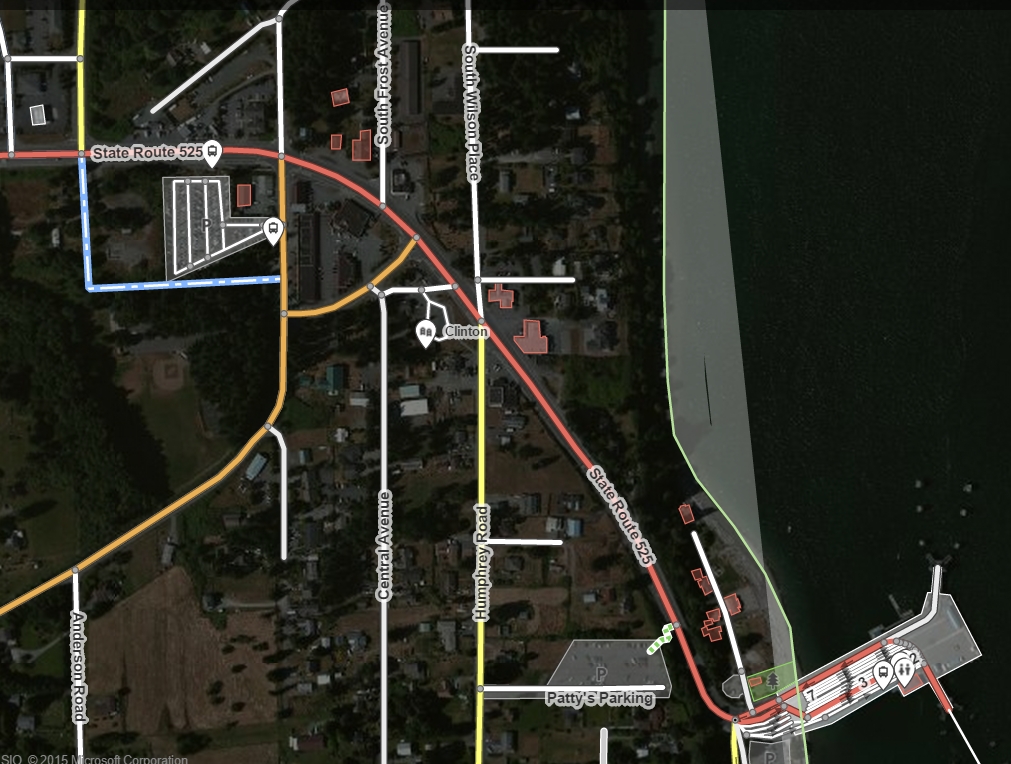
The assignment originally stated that we should map our own neighbourhood. I was not really comfortable with doing that, knowing I’d be publishing a blog post here. Seems like an invitation for harassment and other weirdness. I opted, instead, to visit the last area I lived in back in the United States before emigrating to Europe: Clinton, Washington. In addition to maintaining privacy, this has the added advantage of not overlapping with the territory any of my nearby classmates may have staked out for their projects.
The highway, streets, and ferry dock in the area were already represented, but most of the buildings had not yet been added. I decided to start near the water and work my way up through town a bit. The first challenge quickly became apparent: many of the houses were in shadow. It seems the Bing satellite images were taken late in the day, making it impossible to see the shapes of several houses near the beach.
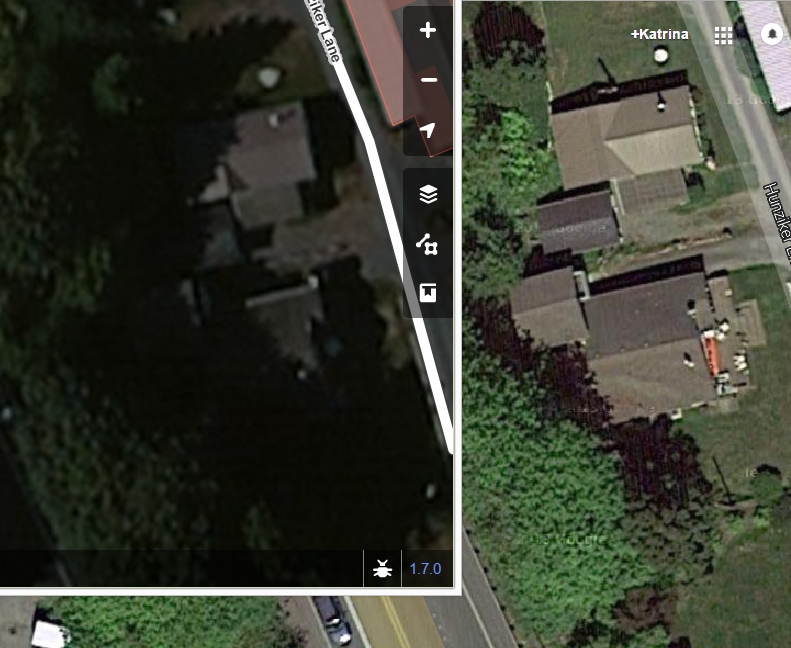
My solution was to pull up the Google Maps satellite photos, shot at an earlier time on a sunny day, and compare them side by side. This wasn’t needed for all areas, just the houses near the ferry dock. I had to estimate a fair bit, but it’s still more information than was previously available. Perhaps Bing will get better satellite data at some point so the details can be finely tuned.
The three basic types of information you can add to a map are points (restaurants, monuments, postal boxes, for instance), lines (highways, streets, pedestrian paths, canals), and areas (parks, buildings, lakes). The choice to map something from my distant past meant adding points would be difficult to do with any level of accuracy. The lines were pretty well covered by previous contributors, as the streets and highways were already marked. I stuck with areas, adding several buildings and a parking lot.
The town itself is quite small. I worked just around the corner from where I lived, so never had to explore much off the main road. I was unable to add business names with confidence, since I have not lived there in over seven years. I did, however, mark some of the commercial buildings as such. My plans for helpfully labelling the post office and gas station were thwarted, as they were already marked. I only dipped my toes in, so to speak, to get a feel for the software. There are still many houses and shops that could potentially be added.
What this Means
What I contributed was fairly minor in the grand scheme of things. As the lines of the town follow the highway, any visitor is not likely to get lost whether or not additional data is present. The bank, gas station, post office, various eateries, and tiny grocery store are all visible from the main strip.
It is conceivable that a catastrophic event could take place which may coincide with a GPS and cell tower outage. Puget Sound is known to occasionally have horrendous wind storms and mudslides, events which knock out power and degrade access to rural areas. High winds can also mean ferries cease running. The phone and data lines are buried, thanks to forethought by the founder of Whidbey Telecom, unlike the power company.
I suppose having access to detailed maps via generator-powered computer could be helpful for emergency services. Perhaps sharing this post with a few friends still living in the area will inspire additional contributions? Hard to say.
Learning & Usage
First and foremost, contributing is easy. Anyone with a browser and internet access can do it. I may have had a slight advantage over some, in that outlining areas is just like using selection tools in Photoshop and GIMP. But really, it’s designed to be easy, particularly if you use iD.
Secondly – primarily due to the ease of use, but also because of the open source nature of the project – I have moved this option up in the hierarchy of possible tools to use in later research. Since depth of involvement is scalable – advanced users can do quite a lot with JOSM – it may really come in handy.
For example, say an American production company has signed on to the idea of accurately depicting a location and culture, GIS (geographic information system) data could be tied into a database of photography, locally shot video, and computer generated models of the area. This would allow production designers and art directors to better envision the visual elements of their film, rather than relying on clips of previous features with their inherent biases and inaccuracies.
Related Examples
In my previous life as a visual effects technician I worked on the film The Mummy. Despite the story being set in Egypt, location shots were done mainly in Morocco. In a later incarnation as a travel blogger, I visited Morocco and undertook an epic journey to visit one of the locations. As a fan, I was delighted to actually visit the place where some of the more dramatic scenes were filmed. It was not, however, Egypt, which would have made the experience even more thrilling.
Since the location, “Hamunaptra”, was a fictional creation it would be hard to have an accurate depiction of such. And yet, had they chosen to shoot in Egypt, the lighting, the landscape, even the extras they hired, would have looked considerably different. A quick Google image search for “egyptian desert” reveals a different colour palette and geology altogether.
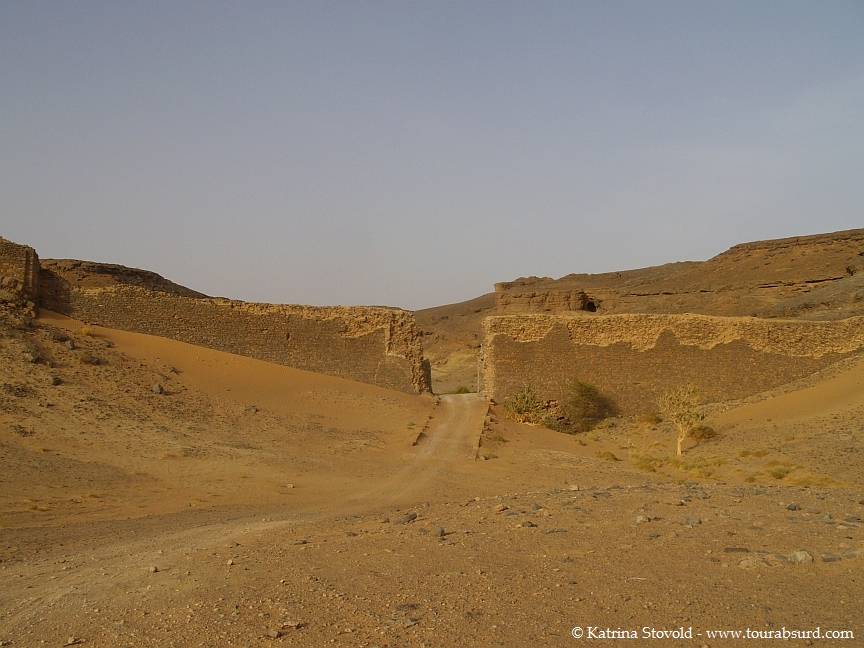 (You can compare the above shot to the battle scene from The Mummy on IMDb: https://www.imdb.com/media/rm3769145600/tt0120616)
Another example, and just for fun, is a post I wrote comparing the real Ngorongoro Conservation Area in Tanzania to the fictional Un’goro Crater in World of Warcraft. Azeroth, the world space where WoW takes place, has many examples of mish-mashed cultural depictions. As it is a fantasy world, the aim was never to have 100% accuracy. Yet I’d say the artists did a pretty impressive job of including several real world details.
Conclusion
OpenStreetMap is not the large tech monster I thought it would be. It’s easy to use. You can get as in depth or remain as basic as you please. There are practical uses for shared data, both for real life situations and artistic purposes. Despite my best efforts to pooh-pooh its usefulness, I may end up using it in future research.